Short_course_08: What is a gridded dataset and how to create it?
Topic outline
-
A case study on pollutants before and after the COVID-19 lockdown with the GOME-2 instrument
with Alessandra Cacciari, Julia Wagemann, Federico Fierli
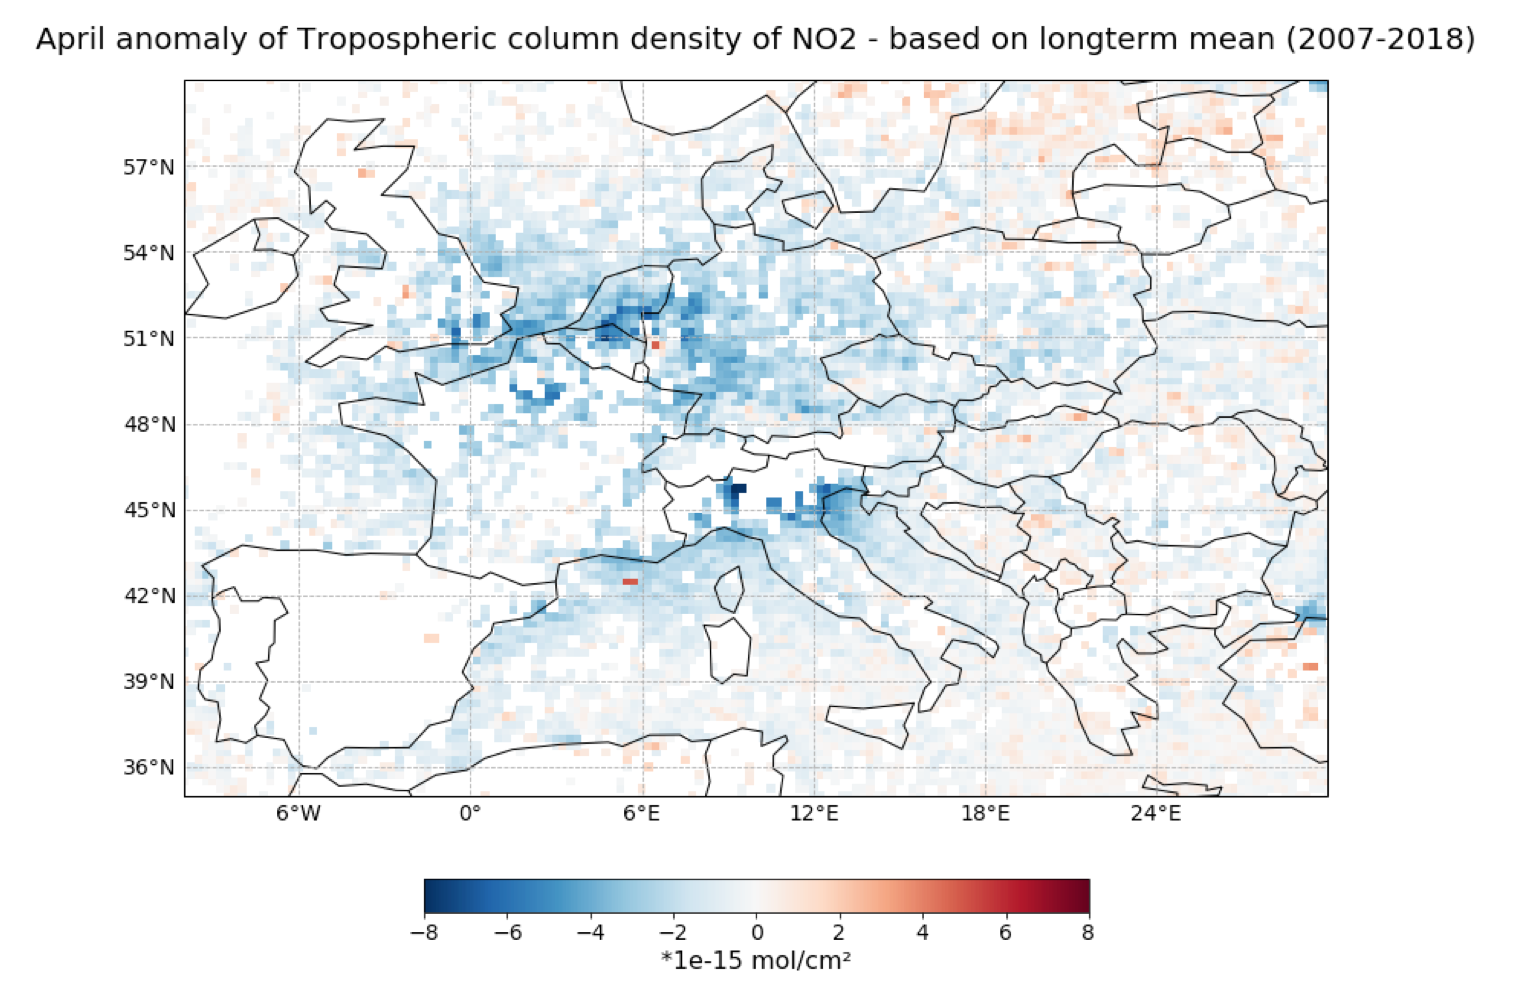
Download, plot and explore GOME-2 Level 2 data, build a gridded (Level-3) dataset of Europe and run basic statistics using Jupyter Notebooks. The activity consists of a live webinar, a self-paced learning period and a live feedback session.
The short course consists of two parts:
- 9 December 2020, 12:00 UTC (13:00 CET) | Live webinar including a practical hands-on session. Join the session at the following Zoom link: https://eumetsat.zoom.us/meeting/register/tJwpduGurTooH9YlYtGGZMuHIKqdEBoWPuuJ ;
- 14 December 2020, 12:30 UTC (13:30 CET) | Live feedback session. Join the session at the following Zoom link: https://eumetsat.zoom.us/j/97064566586?pwd=Ulhrdk5Gb3FUVkNTRy8vVCsyejZOQT09 ;
The short course on 9 December gives you an introduction to the topic and the practical training material. Between the short course and the feedback session, you can work with the data in a self-paced manner. During the feedback session, we will discuss open questions and feedback.
You can engage and ask questions via Slido.com: #EUMSC8
Start familiarising yourself with the data and practical training material ahead of the short course.
See the section 'Jupyterhub and practical training material' on how to get access .
- 9 December 2020, 12:00 UTC (13:00 CET) | Live webinar including a practical hands-on session. Join the session at the following Zoom link: https://eumetsat.zoom.us/meeting/register/tJwpduGurTooH9YlYtGGZMuHIKqdEBoWPuuJ ;
-
The course has the following outline:
- 12:00 - 12:20: Welcome and Introduction (Federico Fierli, EUMETSAT)
- 12:20 - 12:45: GOME-2 Level 2 data (Claudia Cesarini, EUMETSAT)
- 12:45 - 13:25: How to create a gridded dataset - Practical workflow with Jupyter notebooks (Julia Wagemann, MEEO)
- 13:25 - 13:30: Q&A and Wrap-Up (Alessandra Cacciari)
-
The main objectives of EUMETSAT Atmospheric Composition SAF (AC SAF, https://acsaf.org/index.html) is to process, archive, validate and disseminate atmospheric composition products from GOME-2 and IASI instruments onboard EUMETSAT Metop satellites. These products include e.g. total columns of different trace gases such as nitrogen dioxide (NO2), ozone (O3) and sulphur dioxide (SO2), tropospheric column of NO2, CO, UV-radiation, aerosol index as well as ozone profiles. This section describes the products relevant for this course obtained from GOME-2 instrument, while IASI products are described in separate section. Important applications of AC SAF data are e.g. monitoring global air quality or UV-radiation reaching the Earth's surface. In this section you will learn about AC SAF data products, what kind of studies they are useful for, and how you can access the data.
AC SAF provides three different types of datasets of GOME-2 observations: Near Real Time, Offline, and Data Records. The datasets that will be used in this course are:
- Level 2 Near Real Time (NRT) data (trace gases)
- Level 2 and Level 3 Offline data (trace gases, absorbing aerosol index)
- Level 3 Data Records (trace gases)
How to access AC SAF data?
The AC SAF data are disseminated via DLR ATMOS and FMI data services that requires registration. Once registered, you will get access to both services.
The registration can be done here: https://acsaf.org/registration_form.html
- Click registration
- Fill in your information, from the products click as many as you wish. The selection of parameters doesn't limit your access to other parameters available in the services.
- After successful registration you should receive username and password to your email.
-
The course material is made available on a JupyterHub instance, a pre-defined environment that gives learners direct access to the data and Python packages required for following the course.
The JupyterHub can be accessed as follows:
- Web address: https://training.ltpy.adamplatform.eu
- Create an account here.
- Log into the JupyterHub with your account created.
There are 100 places available, which will be given on a first come first served basis.
------------------------------------------------------------------------------------------------------------------------
To reproduce the course modules on your local setup, the following Python version and Python packages will be required:
- Python version: Python3.8
- Python packages include xarray, netCDF4, numpy, matplotlib, cartopy, cdsapi, ipynb, scikit-image and ffmpeg-python
-
Our training activities support users in the member states and among the World Meteorological Organization (WMO) members in the application of EUMETSAT data, products, and services, including Copernicus data provided by EUMETSAT. Find our more at our web page.
Subscribe to the Training Bulletin the joint EUMETSAT, EUMETCAL, EUMeTrain newsletter on new activities and resources in European meteorological training — published every quarter.
Contact us for questions about training events and professional development opportunities at training@eumetsat.int.
Follow us on Twitter @eumetsat_users.