Общее
We invite you to join a workshop, jointly organized by EUMETSAT, The Copernicus Atmosphere Monitoring Service ECMWF, EUMETSAT Satellite Application Facilities (LSA-SAF and AC-SAF) to:
- Inform European-wide services and Users working on wildfires on existing and upcoming products
- Demonstrate the content and the applications of datasets
- Present a selection of initiatives on data access, knowledge sharing and services
- Discuss needs and priorities from experts users in order to define further activities
- Support the preparation of existing and new users on existing and upcoming products from next-generation satellites
ProgramWe propose three morning sessions with contributions from data and service providers, existing projects and national services. Confirmed contribution from data and application experts from EUMETSAT, ECMWF, ECMWF-CAMS, EUMETSAT, Satellite Application Facilities, NOAA (US), Pau Costa Foundation (ES), Pyrolife (NL), IPMA (PT), SMHI (SE) , MeteoFrance (F), Portugal Civil Protection (PT), CIMA Foundation (I), HNMS (GR), Aristotle-eENHSP (EU).
Participation is free and open upon registration here to the Zoom platform.
- Question and Answers, Polls and discussion is supported in slido.com #wildfires2021.
Before the session, please fill in this poll.
- Each session has a discussion part and 1h30 data discovery in the afternoon.
- Data discovery sessions on Tuesday & Wednesday afternoon will introduce you to different satellite- and model-based data.
The session will be hands-on and interactive.
- All the Jupyter notebooks will be made available via a dedicated training platform.
- If you wish to learn more about the featured datasets before the workshop discover the data description sections below.
This is optional and not a pre-requisite.
Agenda (also here)
Presentations25 May - Question and Answers, Polls and discussion is supported in slido.com #wildfires2021.
Before the session, please fill in this poll.
- Each session has a discussion part and 1h30 data discovery in the afternoon.
- Data discovery sessions on Tuesday & Wednesday afternoon will introduce you to different satellite- and model-based data.
The session will be hands-on and interactive.
- All the Jupyter notebooks will be made available via a dedicated training platform.
- If you wish to learn more about the featured datasets before the workshop discover the data description sections below.
This is optional and not a pre-requisite.
Agenda (also here)
EUMETSAT current and future missions - overview on fire-related products, F. Fierli (EUMETSAT)
LandSA-SAF operational products for fire monitoring and forecast, C. Gouveia (IPMA)
Atmospheric Composition Satellite Application Facility products for fire monitoring, A.M. Sundstroem (FMI)
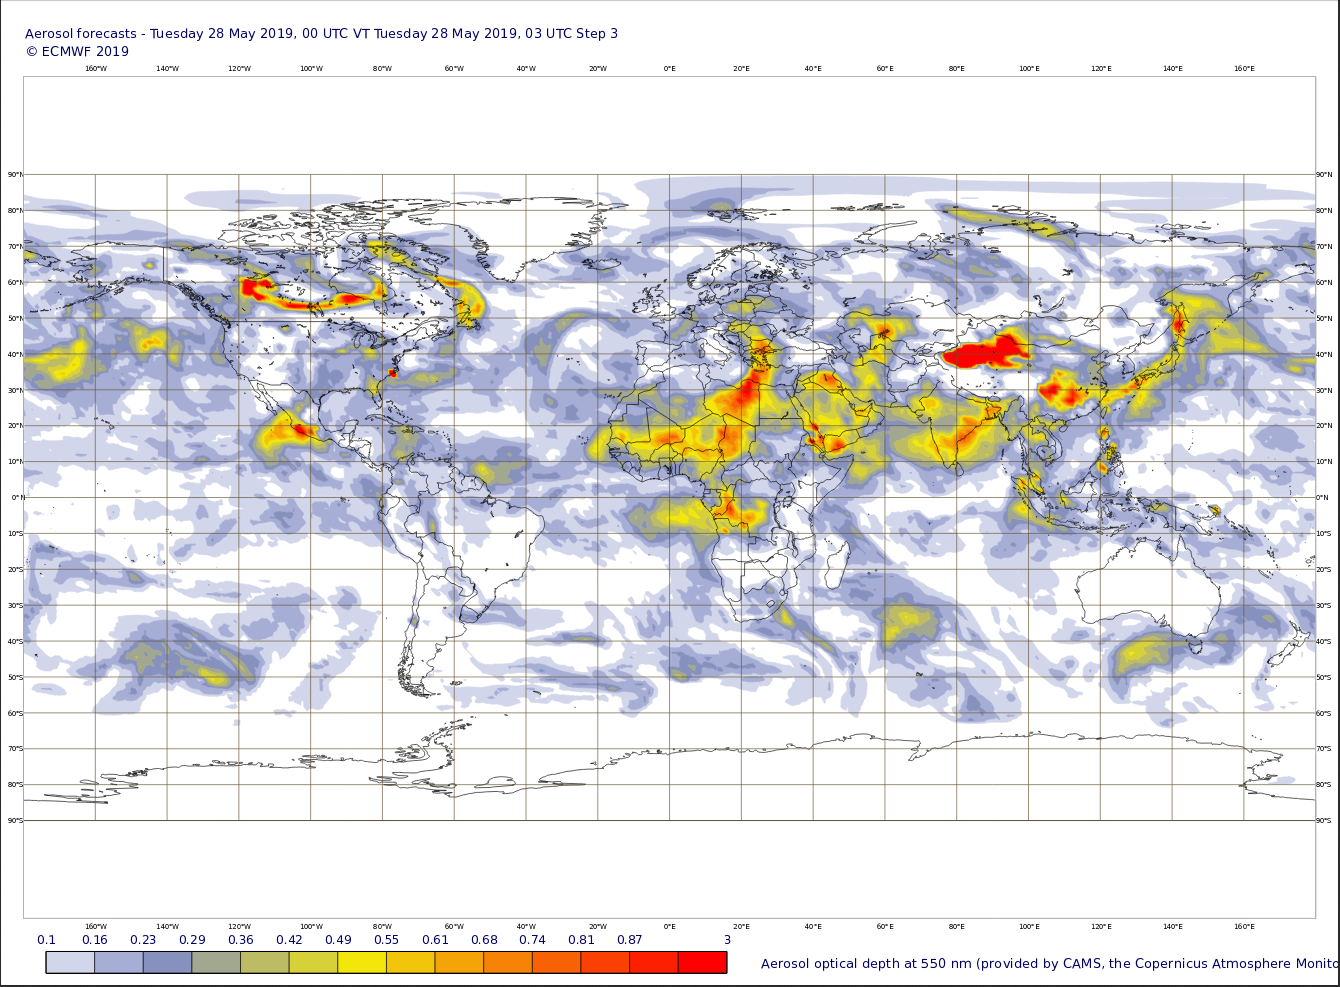
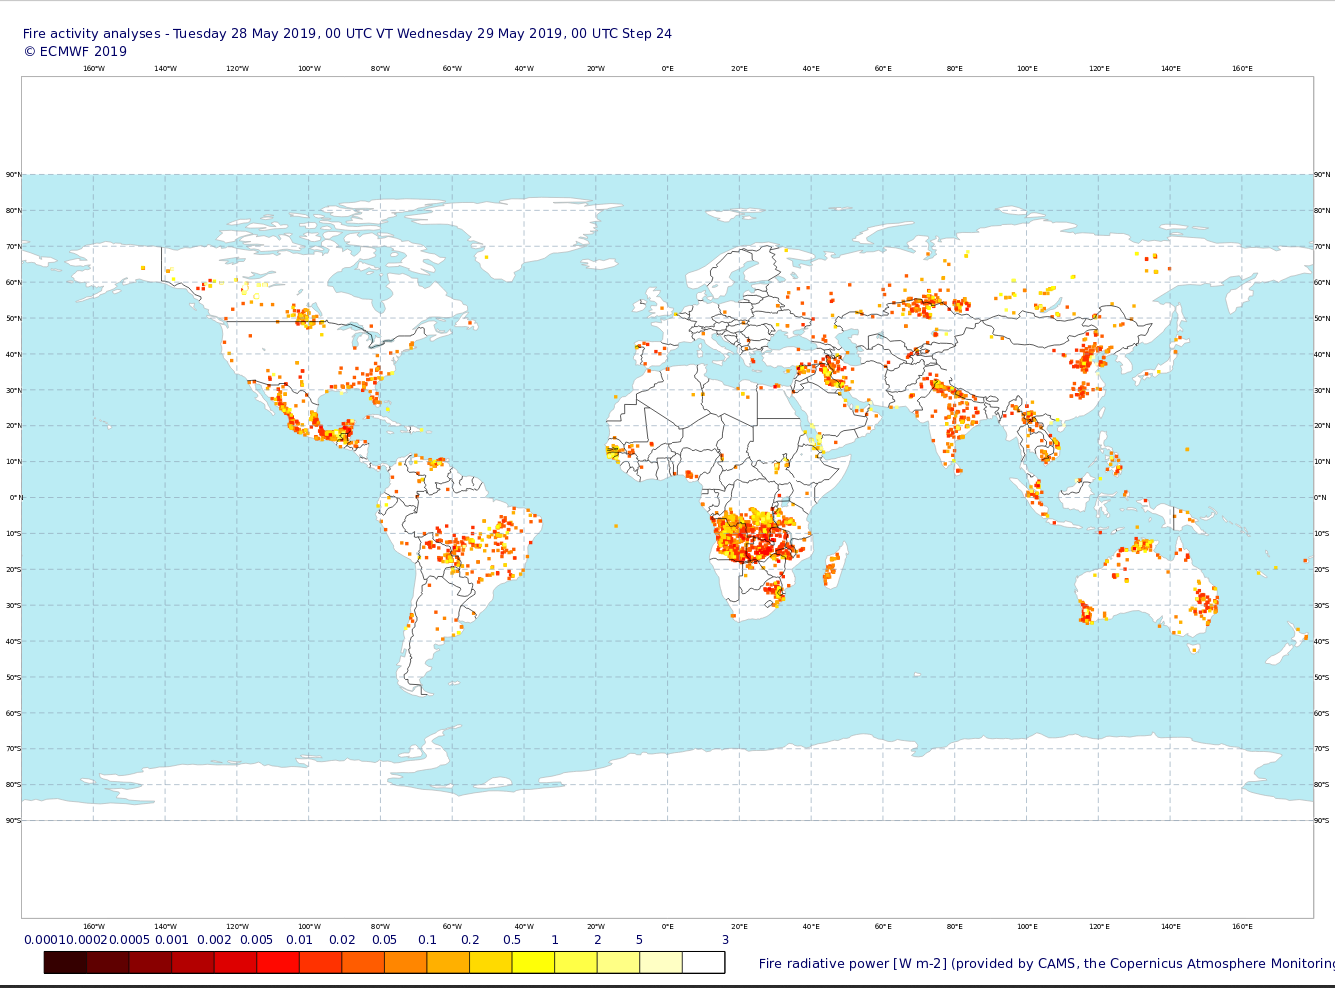
The Copernicus Atmosphere Monitoring Service - fire - related products, M. Parrington (ECMWF-CAMS)
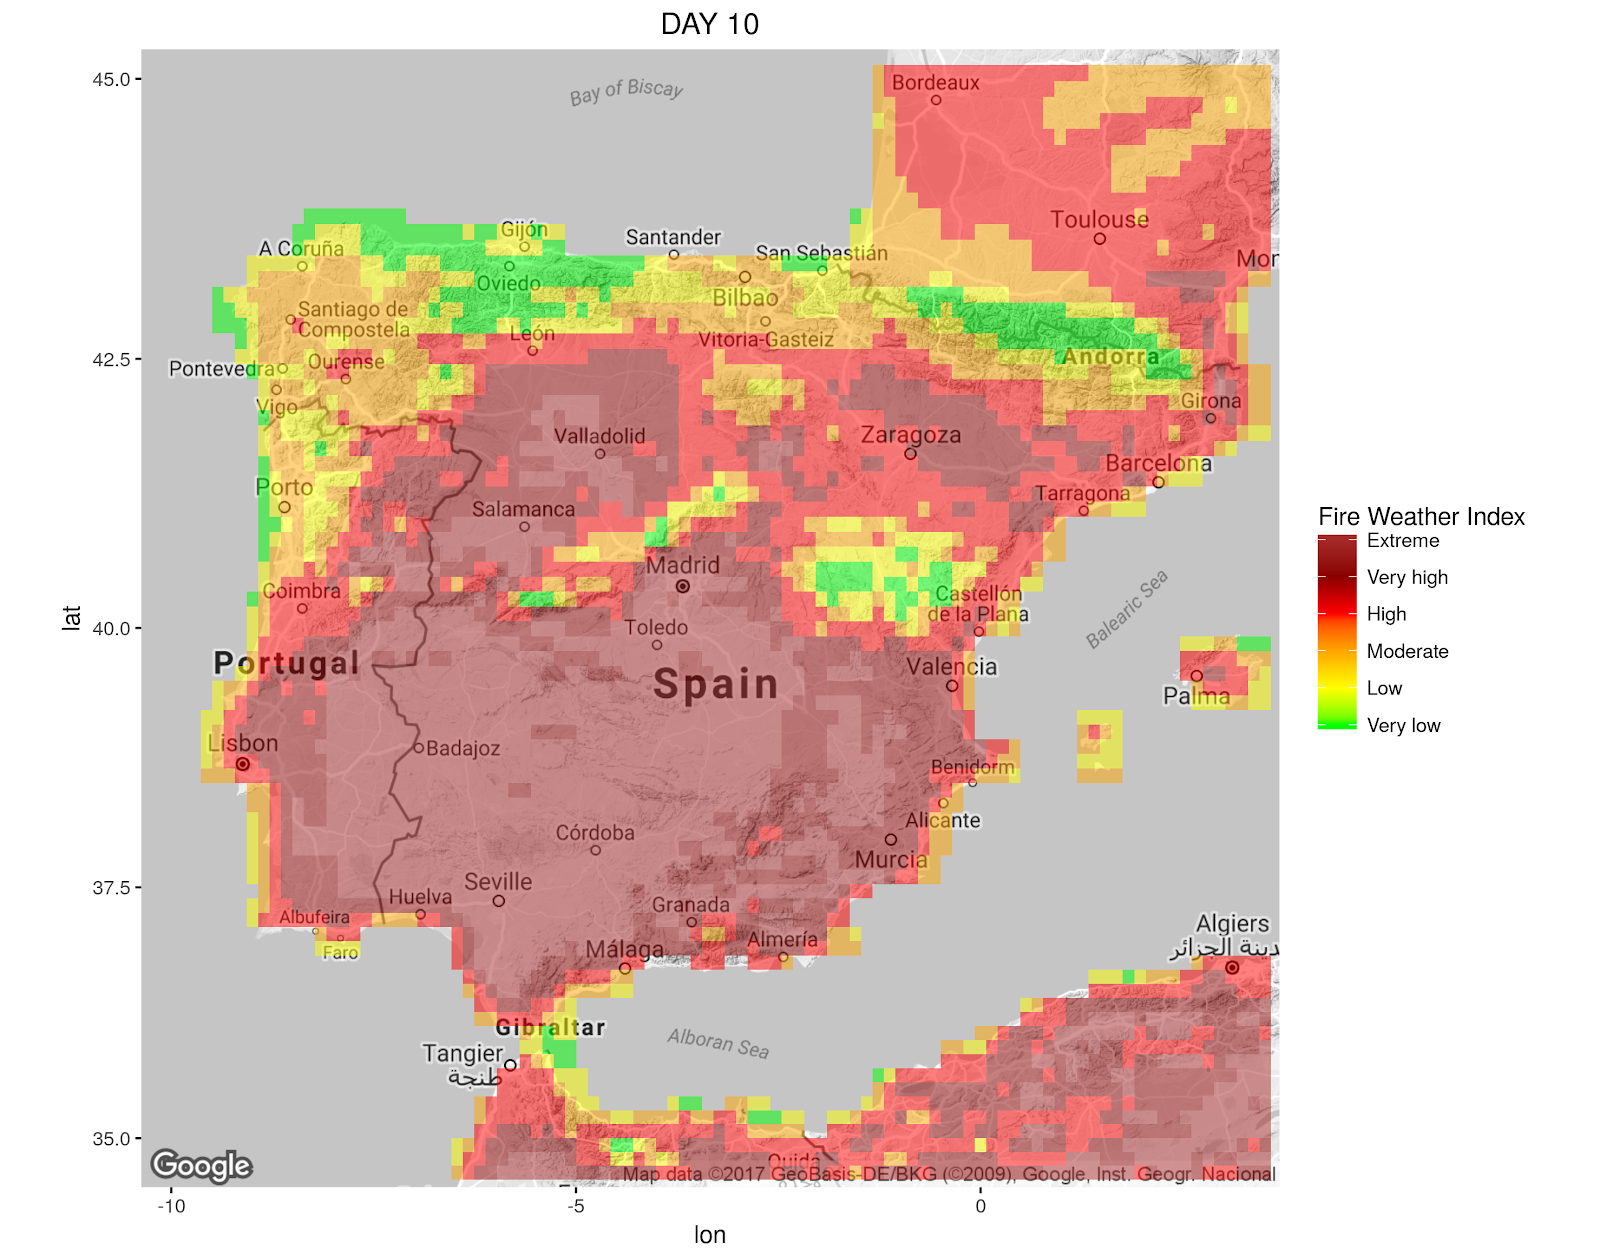
Data and tools to forecast wildfire danger Copernicus Emergency Management Service, C. Vitolo (ECMWF)
NOAA operational fire and emissions products and key applications, S. Kondragunta, I. Czicsar (NOAA)
26 May
Lessons learnt on wildfire monitoring and forecast from theAFAN Network (Pau Costa Foundation)
The pyrolife project, G. Boustras (European University in Cyprus)
Wildfire visualization and communication, Pierre Markuse
Aristotle-eENHSP Project, M. Regimbeau (MeteoFrance)
Advantages and limitations of the operational use of Sentinel-2 for fire danger prediction and automatic update of burned area mapping in Italy, P. Fiorucci (CIMA)
A real-time VIIRS Active Fires detection and warning system for Sweden, A. Dybbroe (SMHI)
Operational Forest Fires products and assessments to Civil Protection Authorities in France, M. Regimbeau (MeteoFrance)
Operational forecasting and Remote Sensing Support on wildfire monitoring and mitigation process, (HNMS)
LSA-SAF operational products for fire monitoring and forecast, C. Gouveia (IPMA)
Meteorological data applied to fire analysis in Portugal, F. Silva (Portugal Civil Protection)
![Sentinel-3 A SLSTR - NRT FRP MWIR [MW] - 05.12.2019 (night-time)](https://classroom.eumetsat.int/pluginfile.php/32360/course/section/3834/20191205_s3a_slstr_frp_mwir_gridded_night_d_map_roi_01.png)
![Sentinel-3 A SLSTR - NRT FRP SWIR [MW] - 26.04.2020 (night-time) - Industry gas flares in Persian Gulf](https://classroom.eumetsat.int/pluginfile.php/32360/course/section/3834/20200426_s3a_slstr_frp_swirnosaa_gridded_night_d_map_roi_14.png)